Binomial Distribution Simplified


If you've ever delved into probability distribution through online videos, chances are you've encountered countless coin-flipping examples. They're classic examples, but let's be honest- they are a bit snooze-inducing. My brain thinks it's nap time whenever it sees those coins in action. 🥱
However, I stumbled upon an exception: a video from CrashCourse that gave the topic a breath of fresh air. Instead of the usual coin flips, it used an amusing example. It was using everyday activities like making toasts and dealing with a cranky old toaster that shocks you to explain binomial distribution. I couldn't help but find it both entertaining and enlightening.
So, in this blog, I'll borrow a page from CrashCourse to share what I've learned about the fundamentals of binomial distribution. We will have to cover some math today. I'm hoping I can sweeten the deal a bit with the help of this amusing example because, let's face it, these distributions have nasty-looking mathematical formulas.
Ok, this is what we will cover:
- What is Binomial Distribution?
- Why is Binomial Distribution Important
- Example of Binomial Distribution
- Binomial Distribution Formula
What is Binomial Distribution?
The binomial distribution is a type of statistical probability distribution. It's a mathematical way that allows us to predict the chances of something happening when there are only two possible outcomes, like success or failure, yes or no, or head or tails.
As I mentioned above, typically, when you're taught about distribution, people love using coin flipping to explain binomial distribution- that's just boring, particularly given that it has many applications in real-world situations. For instance, banks use it to estimate the chances of someone defaulting on loan. Insurance companies use it to set prices for policies and assess the risk of different events happening. In data science, you can also build a machine learning model for detecting liver cancer in medical images. The model would have a binary outcome: it either correctly identifies the presence of cancer (positive) or it doesn't (negative).
Why is Binomial Distribution Important?
There are several reasons for its importance. I think it can be distilled into two:
Modelling Real-World Scenarios: The binomial distribution is a fundamental tool for modelling real-world situations with two possible outcomes, like winning or losing, passing or failing, or getting a yes or no answer. This is useful because many problems in the real world involve binary outcomes, and the binomial distribution helps us figure out what's likely to happen.
Probability Calculations: It simplifies the calculation of probabilities associated with the number of successes in a fixed number of independent trials. This is handy for making decisions, figuring out risks, and quality control in various fields, including manufacturing, finance, healthcare, etc.
Example of Binomial Distribution
Let me take you through the example by CrashCourse first, and then we will look at the equation and plug in some numbers to the equation. Even though the equations are scary but really, they're shortcuts to get to the answer.
Ready for the example?
Ok, imagine that you're standing in your kitchen, operating your old and worn-out toaster. You've realised there's a 20% chance of receiving a painful shock each time you make toast. While you've been meaning to replace the toaster, you simply haven't had the opportunity. As you enjoy toast on weekdays (reserving pancakes for the weekends), you're now pondering how many shocks you might endure this week. Given the stressful week ahead, you've decided that toast is only worth the risk if the likelihood of experiencing a shock is relatively low, preferably just once.
Applying the multiplication rule of probability, you can calculate this. There are five distinct ways to experience only one shock this week: either on Monday, Tuesday, Wednesday, Thursday, or Friday while avoiding shocks on the remaining four days. Representing a shock with an X and a non-shock day with an O, the potential weekly outcomes resemble this pattern.
Now, let's determine the probability of encountering one shock and four non-shocks using the multiplication rule.
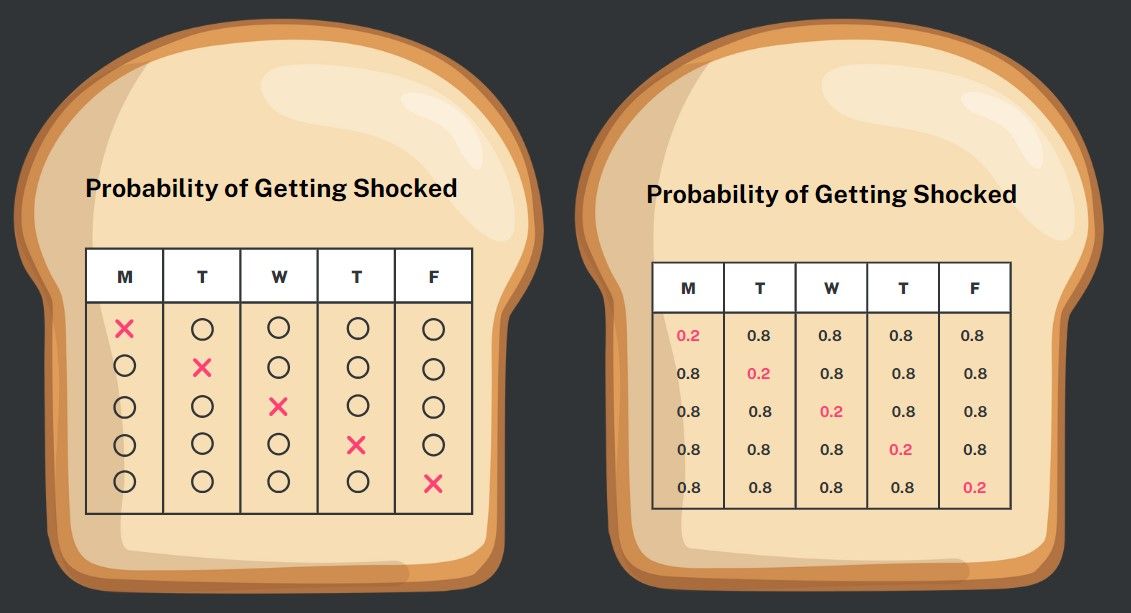
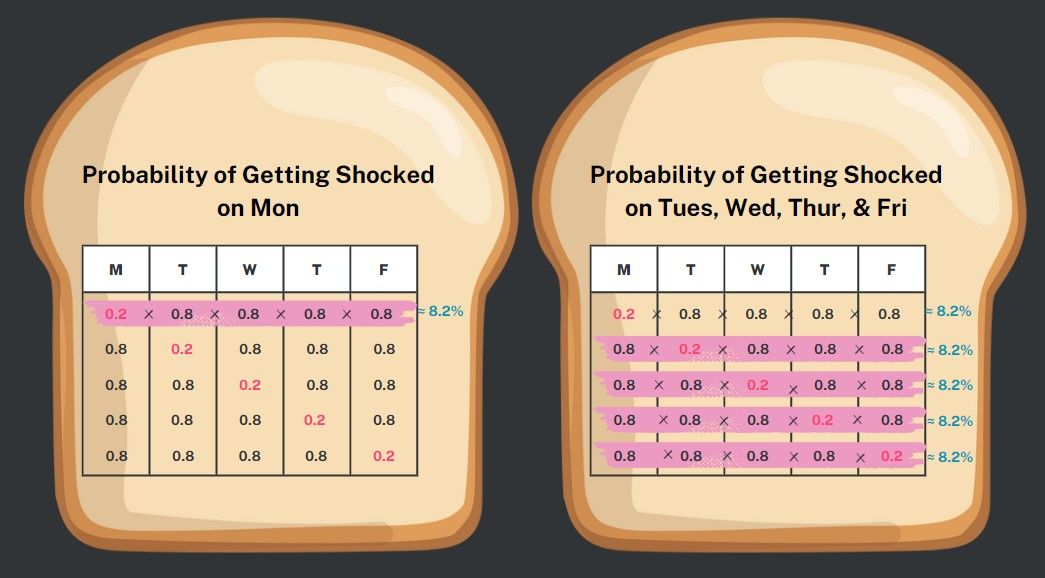
First, let's examine the probability of experiencing a shock on Monday. The chance of getting shocked is 20%, which means there's an 80% chance of not getting shocked on Tuesday. Similarly, Wednesday through Friday each presents an 80% chance of not getting shocked. So, the likelihood of getting shocked on Monday and avoiding shocks on Tuesday through Friday is calculated as 0.2 x 0.8 x 0.8 x 0.8 x 0.8, approximately equal to 0.082. This translates to roughly an 8.2% chance of being shocked on Monday and remaining shock-free for the rest of the week.
Now, we must calculate the probabilities for the other one-shock scenarios. The probability of experiencing a shock only on Tuesday is the same, approximately 8.2%, as the order doesn't matter in multiplication. Then we do the same for Wednesday through to Friday.
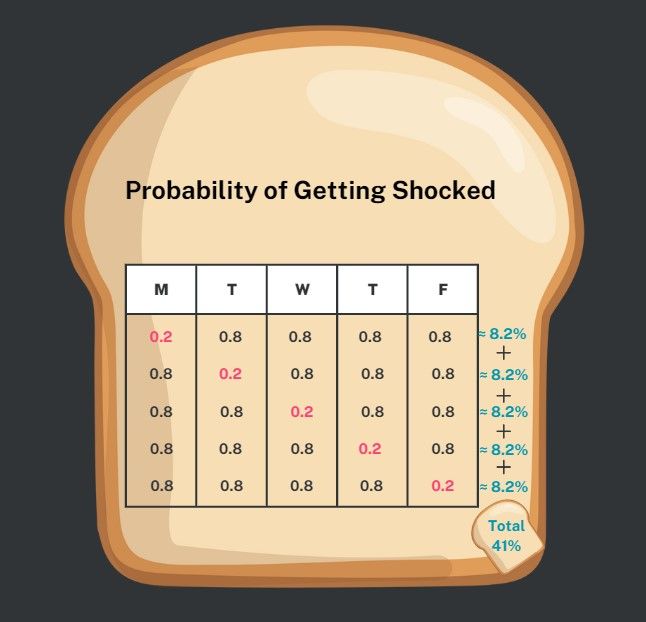
To find the overall probability of experiencing one shock, whether on Monday, Tuesday, or any of the remaining three options, we can use the addition rule. It's a total of 8.2% + 8.2% + 8.2% + 8.2% + 8.2%, which is equivalent to a 41% chance of encountering only one shock throughout this work week. With that, you decided to risk it!
That was a lot of work to figure out whether it was a good idea to risk it! Fortunately, there is a quicker way to do this and that's using the binomial distribution formula.
Binomial Distribution Formula
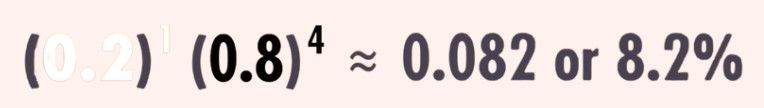
In our toast example, we initially computed the probability of experiencing a single shock by multiplying the daily probabilities together. To simplify this calculation, we utilised exponents to combine the probabilities for encountering a shock (0.2) and avoiding it (0.8), resulting in an approximate 8% probability. Note, the exponents in this formula sum to 5, representing the total days in a week.
This formula is not restricted to assessing the probability of a single shock occurrence; it can also be adapted to calculate the probability of different numbers of shocks. In its general form, it is expressed as follows:

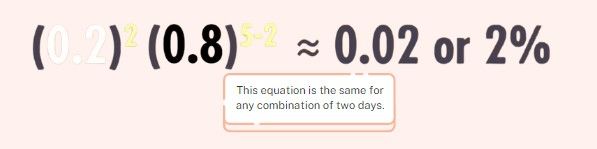
For instance, if we wished to determine the probability of experiencing a shock only on Tuesday and Wednesday, the computation would yield an approximate result of 0.02 or 2%.
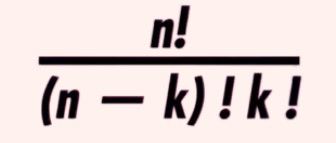
To account for the various ways in which one or two shocks can occur in a week, we introduced the Binomial Coefficient Formula, a valuable mathematical tool derived from combinatorics. This formula facilitates the calculation of the different combinations of successes (avoiding shocks) and failures (encountering shocks) that can take place. It is denoted as (n-Choose-k), with the interpretation being "we have n items, and we want to count how many distinct ways we can select k of them."
In our toast example, where we aim for only one shock (5-Choose-1), there are precisely 5 distinct ways this can happen during the week.

The mathematics behind this formula involves factorials. Factorials are identifiable by their exclamation marks and are known for their enthusiastic appearance! Factorial is the product of an integer and all the integers less than it. For example, if you have 5! (read as "five factorial"), it means you multiply 5 by all the numbers before it: 5x4x3x2x1 = 120.
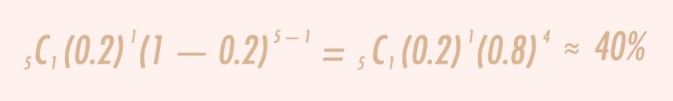
Now that all the components of the binomial distribution formula are in place, we can assemble them. Firstly, we calculate the Binomial Coefficient, which quantifies the ways to have one shock and four non-shocks. Then, we incorporate our multiplication of probabilities. Combining these elements yields the formula for calculating the probability of encountering a shock on any one out of five days in the week, amounting to approximately 40%.
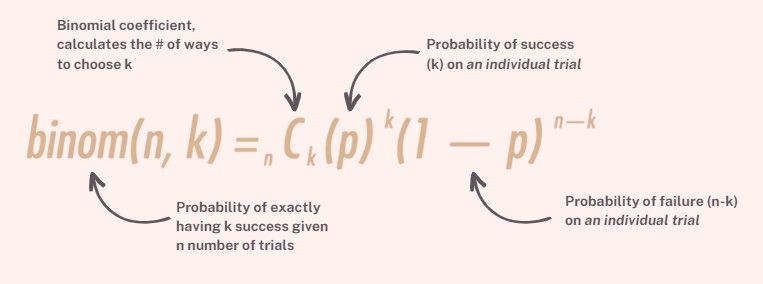
This is the general formula for binomial distribution:
And there you have it. The binomial distribution is a key tool that helps us understand outcomes with two possible results. It's important because we use it to analyse data in different areas like social science, finance, data science and other areas, including helping with breakfast decisions hahaha 😂