Reflection on My Dashboard Development Journey

I was totally clueless when I first dipped my toes in dashboard development. I thought it was just about making charts, but soon, I discovered it entailed much more. In the beginning, the ride was quite turbulent. I had to learn many things—lots of trial and error, with plenty of tears and late nights. I somehow survived and fumbled through the process, realising that dashboard development is a fusion of art and science. To be good at it, you need to have diverse skills spanning design, psychology, statistics, business acumen, and analytics and to delve into data modelling and data engineering elements.
Reflecting on my journey to date, there are three things I wish more people knew about dashboard development. It's not just the practitioners doing the work but also the business leaders. The lack of awareness and understanding leads to insufficient resource allocation, overly optimistic expectations, and unrealistic timelines.
The three key learnings I would like to share are:
- Dashboard Development & Management Process
- Dashboard Development Team Composition
- Development Duration
Dashboard Development & Management Process
In the early stages of my journey, I was oblivious to the structured process behind dashboard development. However, eventually, I discovered that it's similar to the path followed in software or application development. Let me backtrack a bit. You don't necessarily have to approach dashboard development like software development, but without it, it significantly diminishes the likelihood of its success, as I've realised.
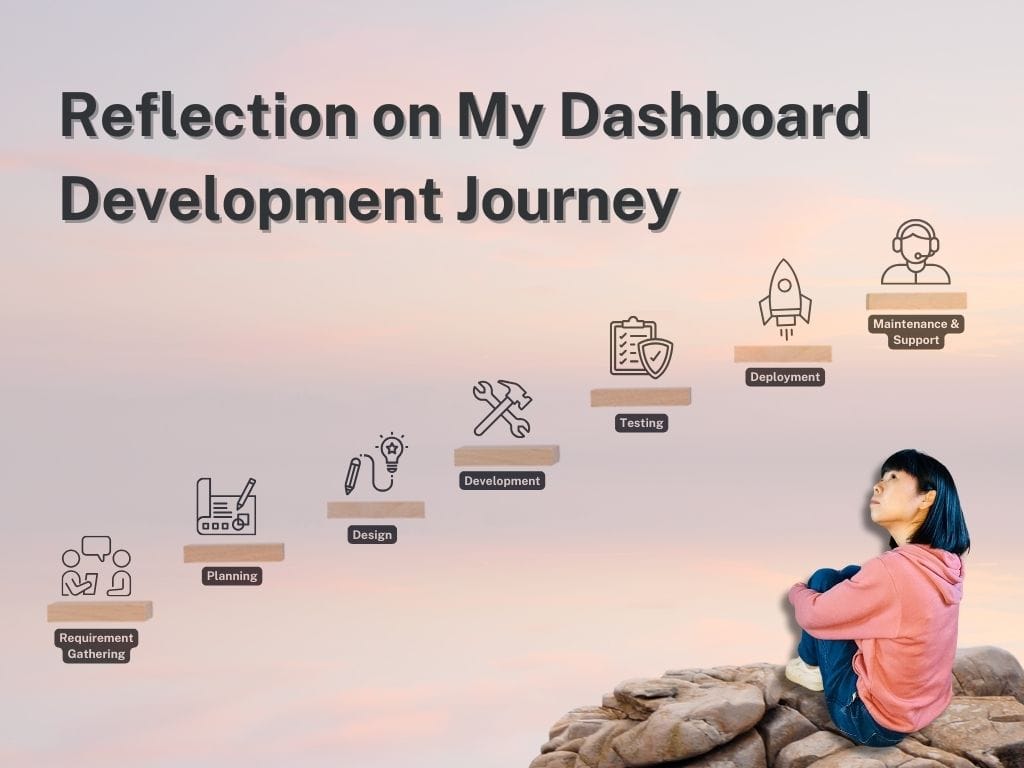
So, what is the process? The process comprises seven stages: requirement analysis, planning, design, development, testing, deployment, and maintenance and support.
Let's look at some of the typical tasks in each stage. The data viz technology I use is Tableau, so I've written below with that frame. The same steps would apply to other popular data visualisation tools such as PowerBI, Qlikview, etc.
1. Requirement Analysis
- Gathering Requirements: Engage with stakeholders to understand the dashboard's purpose, target audience, data sources, and desired visualisations.
- Documenting Requirements: Create a detailed document outlining the specific metrics, KPIs, filters, and interactivity required in the dashboard.
- Prioritisation: Prioritise requirements based on their importance for decision-making and usability.
- Validation: Validate requirements with stakeholders to ensure alignment with business objectives and user needs.
2. Planning
- Project Scope Definition: Clearly define the scope of the dashboard project, including the number of dashboards, data sources, and integration requirements.
- Resource Allocation: Determine the team members involved in dashboard development, including data analysts, Tableau developers, and stakeholders.
- Timeline Estimation: Estimate the time required for data preparation, dashboard design, development, testing, and deployment.
- Risk Management: Identify potential risks such as data availability issues, technical constraints, or changes in requirements.
3. Design
- Data Preparation: Cleanse and prepare the data sources required for the dashboard, including data integration and transformation as needed.
- Dashboard Wireframing: Create wireframes or mockups to visualise the dashboard's layout, structure, and key components.
- UI/UX Design: Design the visual elements, including colour schemes, fonts, and layouts, to ensure clarity and usability.
- Interactivity Design: Define interactions such as filters, parameters, actions, and drill-downs to enhance user engagement and exploration.
4. Development
- Dashboard Creation: Develop the dashboard using Tableau or other data viz tool, incorporating the designed visualisations, filters, and interactivity.
- Performance Optimisation: Optimise dashboard performance by minimising data latency, optimising queries, and reducing load times.
5. Testing
- Data Validation: Validate data accuracy and completeness by comparing dashboard results with source systems or known benchmarks.
- Functional Testing: Test dashboard functionality, including filters, interactions, drill-downs, and responsiveness across different devices.
- User Acceptance Testing (UAT): Involve stakeholders to review and validate the dashboard against their requirements and expectations.
6. Deployment
- Tableau Server Setup: Configure the Tableau Server environment, including user authentication, permissions, and data source connections.
- Publishing: Publish the dashboard from Tableau Desktop to Tableau Server, ensuring proper permissions and access rights are set.
- Scheduling: Schedule data refreshes and extracts on the Tableau Server to ensure the dashboard reflects the latest data.
- Version Control: Implement version control for dashboards to track changes and manage updates effectively.
7. Maintenance and Support
- Monitoring: Monitor dashboard usage, performance, and user feedback to identify any issues or areas for improvement.
- Bug Fixing: Address any reported bugs, data discrepancies, or performance issues promptly to maintain the reliability of the dashboard.
- Dashboard Updates: Make updates and enhancements to the dashboard based on changing requirements, new data sources, or user feedback.
- User Training and Support: Provide training and support to users on navigating and utilising the dashboard effectively.
As you can see, it's quite an in-depth process. Are you wondering if this is all a bit much? Well, that depends on a few things, such as the complexity of the dashboard, the size of the organisation, the importance of the dashboard to business operations, and the resources available. But I think it's beneficial to have a lightweight version of this if the full version is not feasible.
A structured process helps ensure you're ticking off boxes one step at a time, so nothing important slips through the cracks. It also sets you up for smoother maintenance, updates, and down-the-line growth as the organisation grows and evolves.
Something I would like to add, and I can't stress enough its importance, is the inclusion of feedback from key users, particularly during the design phase. Given the substantial effort involved in development, validating it with stakeholders is crucial. This ensures alignment with user needs and will improve its adoption.
Dashboard Development Team Composition
Dashboard development is a team sport. However, from my experience and what I've gathered from my LinkedIn network, often one person covers the full spectrum. It's pretty absurd! At its best, I was fortunate to have worked with a colleague on a BI project. It wasn't our core role; we were like a dream team. We both understood the business. We would challenge each other and work our way through every obstacle. I mainly covered the front-end development work, such as gathering requirements and design and development work, and he focused on the backend work, like data pipeline and modelling. We played to our strengths. We understand enough about each other's area to help when we get stuck. I miss working with him.😔
Anyhoo, I digress. Coming back to the team composition. Here are the primary roles commonly involved:
Business Analysts/Domain Experts:
Business analysts or domain experts play a crucial role in understanding the business requirements and objectives of the dashboard.
They work closely with stakeholders to gather and document requirements, define key performance indicators (KPIs), and ensure that the dashboard meets the needs of its intended users.
Data Engineers/Data Architects:
Data engineers or data architects are responsible for the design, development, and maintenance of the underlying data infrastructure.
They work on tasks such as data integration, data modeling, data cleaning, and data warehousing to ensure that the dashboard has access to accurate and relevant data.
Data Analysts/Data Scientists:
Data analysts or data scientists analyse and interpret data to derive meaningful insights.
They collaborate with business analysts to understand data requirements, perform data analysis, create data visualisations, and validate the accuracy of dashboard metrics.
Dashboard Designers/UI/UX Designers:
Dashboard designers or UI/UX designers focus on creating an intuitive and visually appealing user interface (UI) and user experience (UX) for the dashboard.
They work on wireframing, prototyping, layout design, colour schemes, typography, and interactivity to ensure the dashboard is user-friendly and engaging.
Dashboard Developers:
Dashboard developers are responsible for building and implementing the dashboard based on the requirements and designs provided.
They use tools like Tableau, Power BI, or other dashboarding platforms to create interactive visualisations, dashboards, and reports, incorporating data connections, calculations, and user interactions as needed.
Quality Assurance/Testers:
Quality assurance (QA) testers are responsible for testing the dashboard to ensure it meets quality standards and performs as expected.
They perform various types of testing, including functional, usability, performance, and cross-browser/device testing, to identify and address any issues or bugs.
Project Managers/Scrum Masters:
Project managers or scrum masters oversee the dashboard development process, ensuring the project stays on track, meets deadlines, and stays within budget.
They coordinate the activities of the various teams, facilitate communication, manage risks, and resolve any conflicts or impediments that may arise during development.
One person can wear multiple hats. However, you'll find if such a project is outsourced to technology solutions corporations like Cognizant, TCS etc, you'll find that there is a specialist for each of these role.
Development Duration
The development duration can vary significantly depending on various factors, such as the complexity of the dashboard, the availability and quality of data sources, the level of interactivity required, the size and expertise of the development team, and the organisation's internal processes. However, here is a general estimate based on typical scenarios:
Small to Medium-Sized Dashboard: For a relatively simple dashboard with a few visualisations and basic interactivity, the development and deployment process might take around 2 to 6 weeks.
Medium to Large-Sized Dashboard: For a more complex dashboard with multiple interconnected visualisations, advanced calculations, and interactive features, the development and deployment process could range from 6 to 12 weeks or more.
Enterprise-Level Dashboard: For large-scale enterprise dashboards with extensive data integration, complex business logic, multiple user roles, and high levels of customisation, the development and deployment timeline could extend beyond three months, possibly up to 6 months or longer.
It's important to note that these estimates are approximate and can vary based on each project's specific requirements and circumstances. Factors such as iterations, stakeholder feedback cycles, unexpected technical challenges, and resource availability can also influence the timeline.
And that's a wrap! My journey through dashboard development has been quite the rollercoaster, with its fair share of highs and lows. But through it all, I've gained invaluable knowledge and experience. I've come to realise the crucial elements necessary for success and the importance of treating a dashboard like an application (i.e. product), and applying the same development process rigour as product development. I hope you found this reflection insightful.