Design Thinking Meets Dashboard Development

This blog is a week late- apologies. I spent my last weekend turning around a hefty assignment. The project? I was tasked to assist Daniel, a national marketing manager at Spotify, in navigating through an enormous Excel file with ~ 58,000 data points on Spotify and its competitor, YouTube.
Daniel is a fictitious character. He has an enthusiasm for data and insights and is a firm believer in the power of data visualisation, an appreciation I wish more leaders shared. Data visualisation is extremely powerful; when done effectively, it can communicate complex information quickly, leveraging our most dominant sense: vision.
If you're curious about what I whipped up for my assignment, I've dropped my work on GitHub and Tableau Public. It's a bit empty for now, but I plan to beef it up. Stay tuned!
• GitHub for the data deep dive, aka EDA: check it out here
• Tableau Public for the shiny dashboard: take a peek here- Spotify vs YouTube
I noticed the dashboard on Tableau Public doesn't look as crisp as on my Tableau Desktop. If you know why that is, let me know!
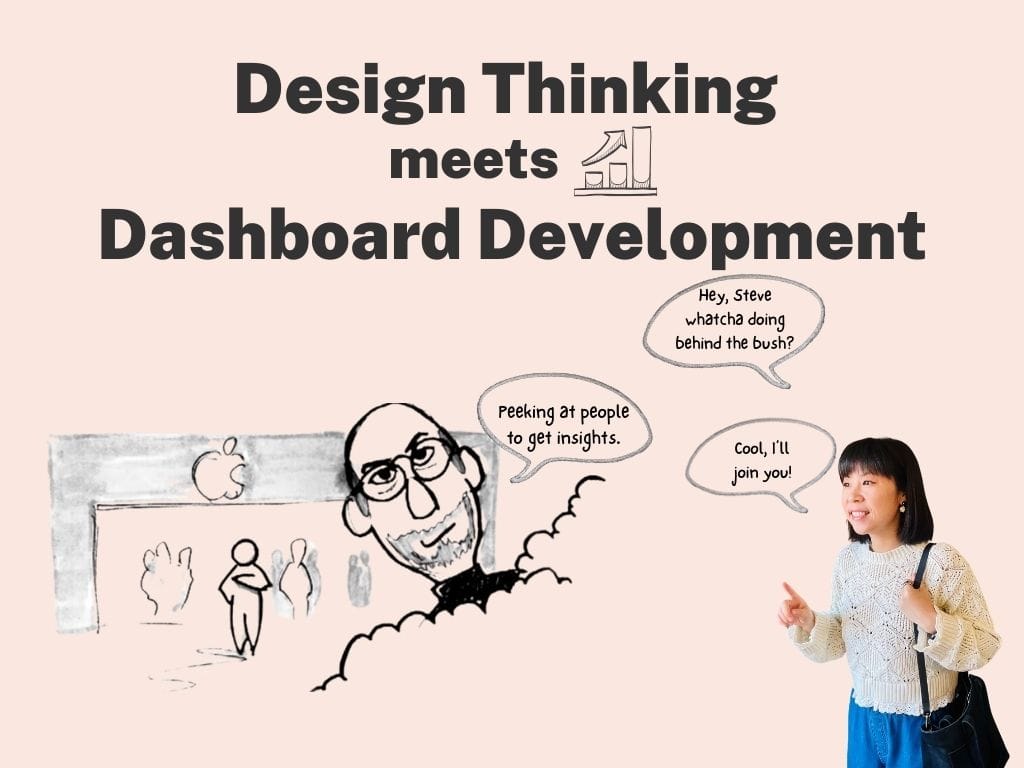
Aside from the hustle of this assignment, I've been delving into Design Thinking. It's a buzzword you might have heard of. It enables "insight-led innovation", which I agree if done right. It's a new term for something that has existed for some time. My introduction to this term came about a decade ago, during a workshop conducted by IDEO when I was still working for Merck Sharp and Dohme. It was an eye-opener, especially seeing how observing interactions in the users' environment can lead to valuable insights. This is a method Steve Jobs famously used. Apparently, Steve Jobs hides in bushes to spy on his customers at his local Apple store so he can cultivate insights!
So, why bring up design thinking here?
Design thinking offers a solid approach to creating impactful services, experiences and products; yes, dashboards are a product form. Design thinking emphasises understanding user needs and crafting solutions that genuinely meet those needs. For anyone looking to ensure their reports and dashboards truly serve their purpose and don't end up gathering digital dust, give design thinking a go!
So, in this blog, we will cover:
- What is Design Thinking, a Closer Look
- The Five Stages of Design Thinking
- Design Thinking Applied to Dashboard Development
What is Design Thinking?
At its core, Design Thinking is about solving problems with a focus on the people you're designing for. It is not limited to traditional design fields such as graphic or industrial design; it applies to any area where innovative solutions are needed. Design thinking involves understanding the needs of the people you're designing, redefining problems in a human-centric way, brainstorming creative solutions, prototyping, testing and iterating.
The Five Stages of Design Thinking
Design Thinking is a process comprised of several stages, which can vary but generally include the following five stages. While the stages are laid out linearly, they are not linear; instead, they are iterative, and more likely than not, you may have to visit any of these steps several times.
-
Empathise: Understand the needs, motivations, and behaviours of the people you are designing for by engaging with, observing, or even walking in their shoes. This helps to gain deep human insights and empathy for your users.
-
Define: Synthesise the information gathered during the empathy stage to identify the core problems. This stage involves framing the problem in a human-centric manner.
-
Ideate: Brainstorm a range of creative solutions to the problem. This stage encourages thinking outside the box to identify new solutions to the problem statement created, and it values quantity over quality of ideas.
-
Prototype: Turn ideas into tangible products. This could be anything from a paper model to a digital mock-up. Prototypes are often simplified versions of the solution designed to test specific aspects of the solution.
-
Test: Share prototypes with users to gain feedback on how to improve and refine them. This stage involves observing and learning how users interact with prototypes identifying any issues or opportunities for further innovation.
Design Thinking Applied to Dashboard Development
Creating a dashboard that resonates with users and gets used can be challenging. I've made several that are just there gathering dust. However, by applying a design thinking process, I firmly believe we can significantly increase the likelihood of our dashboard meeting its intended goals. Here's how I've been using these principles:
Empathise with Your Users
The first step in applying design thinking to dashboard design is empathising with the users. It is crucial to understand who the dashboard users are, what challenges they face, and what information they need to make decisions. With dashboards, trying to communicate to too many different people with different needs at once isn't going to go well. We put ourselves in a position where we can't communicate to any of them as effectively as we could if we narrow our target user(s). So, a recommendation of mine is to narrow down to a primary user group; if you must, you can include a secondary user group. Your design and thinking should revolve around these user group(s).
How can you empathise with users? Well, this might involve conducting interviews, surveys, or observational studies. Apart from interviewing, I enjoy sitting in a meeting room and observing the users, taking notes of what's important to them and anything about them that surprises me. I also study artefacts, such as their PowerPoint presentations, for insights. The goal is to gather as much insight into their goals, preferences, and pain points as possible.
Define the User Needs and Problems
After collecting user insights, the next step is to define the core problems/questions your dashboard aims to address. This involves synthesising the gathered information to identify common themes, needs, and challenges. The definition stage helps focus on the most important to the users, ensuring the dashboard design addresses these needs effectively. If feasible and the user group is readily available, playback your understanding of the core problems/ questions to them so you get confirmation whether you are on the right track.
Ideate Solutions
In the ideation stage, it's time to get creative. This phase is about brainstorming variety of ideas, considering different data sets, visualisation methods, and organising structures. Techniques such as brainstorming, sketching, and mind mapping can be useful. The aim is to develop multiple potential solutions that can be refined and combined into the final design.
I've recently found a preference for sketching on paper. While digital tools offer many advantages, they tend to slow down the initial creative process for me. Another challenge with starting digitally is the tendency to become overly attached to early concepts, making it hard to explore alternatives. Paper sketching, on the other hand, offers a certain freedom. If an idea doesn't pan out, it's easy to move on without hesitation.
Prototype Potential Solutions
Prototyping is the stage where ideas are transformed into concrete solutions. In the dashboard design context, I take my initial sketches and develop them into low-fidelity or high-fidelity mock-ups. The prototyping phase is important because it brings the concept to life, allowing you to see how the dashboard will look and operate. This step is invaluable for assessing the design's effectiveness in addressing user needs, as it provides a clear visualisation of the end product.
Test and Refine
The final stage of the design thinking process is testing. This involves sharing the prototype with users to gather feedback on its usability and effectiveness. Testing can reveal whether the dashboard meets the users' needs, is easy to navigate, and presents information in a clear and actionable manner. The dashboard design can be refined and improved based on feedback before final implementation. Sometimes, this feedback might prompt a revisit to earlier stages for further adjustment.
There you have it. I believe this design thinking is a valuable framework to help ensure an effective dashboard. We can create dashboards that meet and exceed user expectations by empathising with users, defining their needs, ideating solutions, prototyping, and testing. This approach leads to dashboards that are not just tools for viewing data but powerful instruments for making informed decisions.