Outliers and Anomalies in Data


A colleague of mine, a whiz when it comes to data science, ran a training session about data outliers and anomalies earlier this week. She even demoed a tool she developed for spotting these quirky data points.
Regrettably, I couldn't attend the training session because of a conflicting commitment. I was at an Alteryx analytics event sponging in new knowledge, networking, and collecting free swags! 😁 But, I remember telling her that I would dive into this topic and write a blog post on this.
So, here we are! This blog post is me making good on that promise, catching up on what I've missed, and sharing what I've picked up about data outliers and anomalies.
In this blog, we will cover the following:
- What are Outliers and Anomalies?
- What is the Significance of Outliers and Anomalies?
- Why do Outliers and Anomalies Exist?
- Outliers and Anomalies Detection Techniques
- Handling Outliers and Anomalies
What are Outliers and Anomalies?
In data analysis and machine learning, outliers and anomalies play an important role in understanding hidden patterns and uncovering valuable insights.
Outliers and anomalies are like the black sheep in a dataset. They are data points that significantly differ from the rest. Outliers and anomalies are often used interchangeably but have slightly different meanings. Outliers generally refer to extreme values that lie far away from most data points, while anomalies are unexpected or unusual observations that may not necessarily be extreme.
What is the Significance of Outliers and Anomalies?
You might wonder, "Why should I care about these oddballs?" Well, outliers and anomalies are crucial for a couple of reasons:
Firstly, they can significantly impact the results of your data analysis. For instance, if you're trying to calculate the average income of patrons at a local bar, and it just happens that Elon Musk happens to be one of the customers, the average income will be skewed.
Secondly, anomalies can often suggest something interesting or important. For instance, an anomaly might represent a fraudulent transaction on a credit card. In healthcare, an outlier could indicate a medical condition that deviates from the standard, such as atrial fibrillation (irregular heartbeats).
By identifying these outliers and anomalies, we can either manage them appropriately or investigate them for potential new insights.
Why do Outliers and Anomalies Exist?
Anomalies and outliers can arise due to various reasons, such as measurement errors, data entry errors, sampling errors, or pure chance. In some instances, they can occur due to extreme variations in the system being observed.
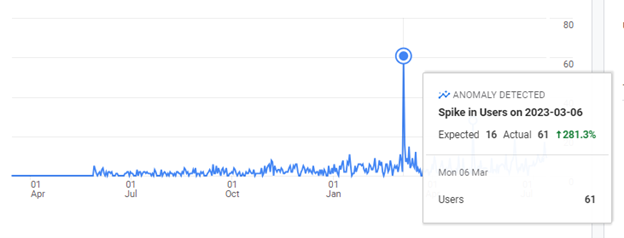
Anomalies may also emerge due to novelty or change. For example, in a time series dataset of website traffic, a sudden surge in traffic might be due to a new product release or marketing campaign.
Here is a time series of my website traffic from creation to date. I created my website in early 2022 and procrastinated for about two months before I had the courage to release my very first content into the wild of the world wide web. For a good year since its creation, traffic was minimal; it was mainly me and a few close friends visiting the website. The anomaly you see below on the 6th of March 2023 was the day I publicly promoted it on Facebook.
Outliers and Anomalies Detection Techniques
Detecting outliers and anomalies is like playing detective. There are several techniques we can use:
Visual Inspection
Visual inspection is one of the simplest and most intuitive methods for detecting anomalies in data. It involves creating a plot or graph of the data and then visually scanning it for any points that seem to deviate from the expected pattern. Here are a few types of plots that are commonly used for visual anomaly detection:
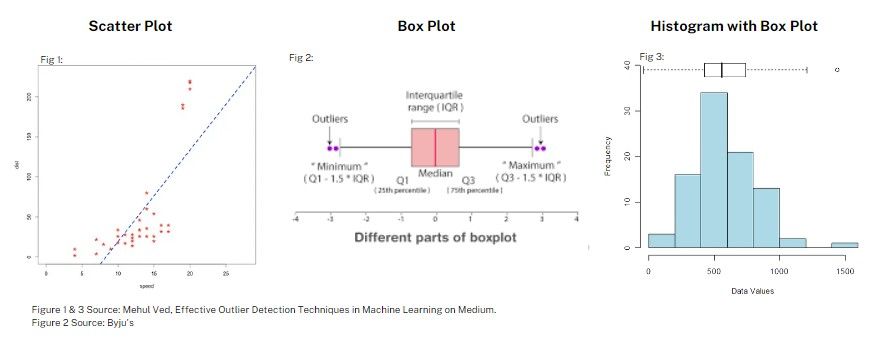
- Scatter plots are used to visualize the relationship between two variables. Each point on the plot represents an observation from the dataset, and its position along the X and Y-axis represents its values for the two variables. Anomalies appear as points that are far away from the others.
- Box plots (aka whisker plots) are used to display the distribution of numerical data through their quartiles visually. The 'box' contains the middle 50% of the data, the line inside the box is the median, and the 'whiskers' are lines extending from the box, indicating variability outside the upper and lower quartiles. Outliers are often displayed as individual points in line with whiskers but a certain distance away from the box.
- Histograms: Histograms plot the frequencies of data points in successive, non-overlapping intervals. Anomalies would appear as bars distant from the bulk of the data.
- Time-Series Plots: Time-series plots are used when working with time-series data, or data indexed by time. Anomalies in time-series data often appear as sudden spikes, dips, or a break in the data pattern.
Visual inspection is a good starting point for anomaly/ outlier detection. Still, for large or complex datasets, you'll likely need to use other techniques like statistical or machine learning methods as well.
Statistical Method
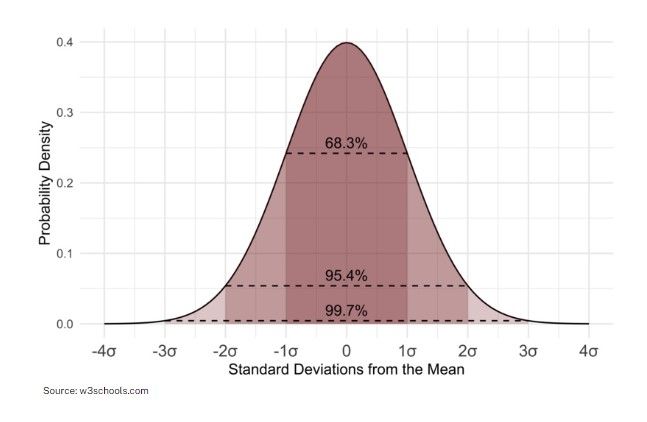
Statistical method is one of the most straightforward approaches to anomaly detection. It involves calculating the mean (average) and standard deviation (which measures the dispersion of data from the mean) of the data. Any data point outside a certain range is considered an outlier, usually 2-3 standard deviations (σ) from the mean. In a normal distribution (aka Gaussian distribution), it is expected that the majority of the values will fall within 2-3 standard deviations from the mean.
Approximately 68% of the data points lie within 1 standard deviation of the mean, about 95% fall within 2 standard deviations, and about 99.7% fall within 3 standard deviations.
This method isn't very effective for complex data and data that do not follow a normal distribution.
Machine Learning
Machine learning techniques can be very effective for anomaly and outlier detection. It can handle complex, multi-dimensional data. It can learn and adapt to new patterns in the data. Machine learning technique includes methods like clustering (grouping similar data points together), classification (predicting the class of a data point), and neural networks (complex models that can learn patterns in the data).
Handling Outliers and Anomalies
What do you do with the outliers and anomalies after uncovering them? It depends on the situation and the nature of the data. Here are a few strategies:
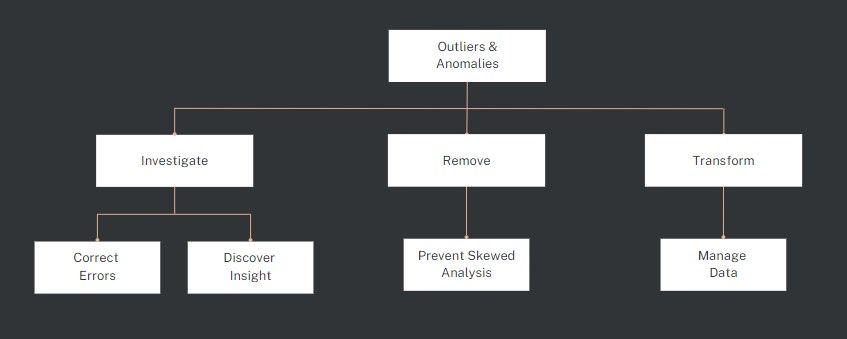
Investigate: If an outlier or anomaly is due to a data entry error or a malfunctioning sensor, it should be corrected if possible. It might be worth investigating if it's a legitimate data point. It could lead to a new discovery or insight.
Remove: In some cases, especially when the outlier skews the overall analysis, it might be best to remove it. Often this is the last resort. The first step is usually to understand why.
Transform: Sometimes, applying a mathematical transformation can bring outliers closer to the other data points, making the data more manageable. For instance, in a dataset of housing prices, a logarithmic transformation can compress the range of values and reduce the impact of an extremely high-priced outlier.
While outliers and anomalies can be challenging to deal with, they add a layer of complexity and intrigue to data analysis. They remind us that the world isn't always neatly packaged into average values and standard deviations. Sometimes, it's the odd, the unusual, and the unexpected that make life interesting!
Remember, unusual is not always unwanted in the realm of data. Sometimes, the unwanted leads you to unlock the most profound insights.