Time series Forecasting


I've been delving into forecasting lately. Even with some background, I realize there's a whole heap for me to learn and discover. I find forecasting fascinating. Its allure isn't sorely its practical advantage of glimpsing the future or curbing uncertainties. For me, it also lies in the intellectual stimulation it offers- it gets you flexing your thinking muscles.
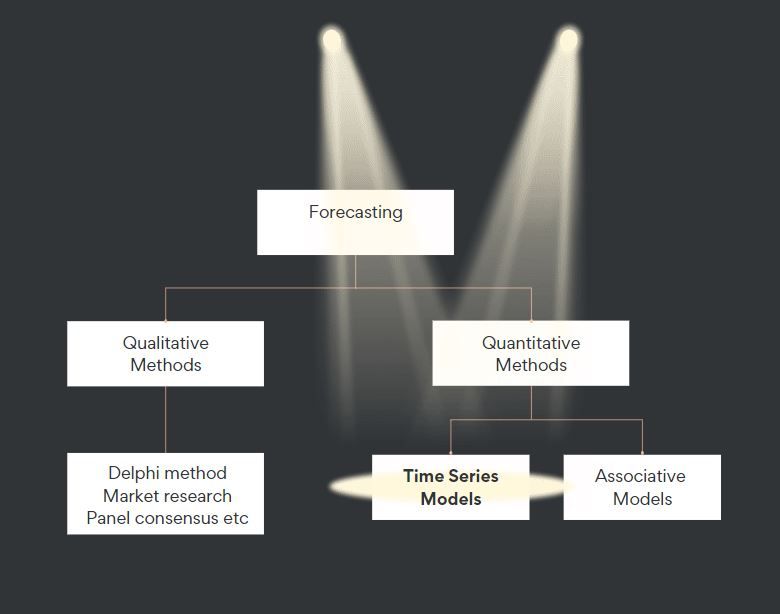
Forecasting is a very broad topic. It comes in two primary flavours: qualitative and quantitative. Qualitative leans on expert views and is great for uncertain stuff, like launching a new product. On the other hand, quantitative uses past data and math to predict future trends.
I mainly deal with quantitative at work, and I prefer it. I like how it's reliant on hard data and mathematical models; it just offers more objectivity. That's not to say I don't value the qualitative type. Each has its strengths and is suitable for different scenarios.
Let's move into the quantitative side and have a closer look. On the quantitative side, we have two types of models: time-series models and associative (or causal) models. The former looks at historical data patterns to forecast future trends, while the latter predicate projections on the correlation between the forecasted variable and other variables.
In this blog, I'll put the spotlight on time-series models. However, before delving into time-series models, let's understand the importance of properly framing our forecasting problems. Often, we rush into data analysis without understanding the actual problem and its context, which can lead to unnecessary anxiety. Drawing from my own experience, I can say that this approach is not recommended. Before you start the analysis, get clear on the problem. The clearer the problem, the smoother the forecast!
So in this blog, this is what we will cover:
- Importance of Well-Formulated Forecasting Problem
- PHIVE Framework
- Common Time Series Models
Importance of Well-Formulated Forecasting Problem
A well-formulated forecasting problem is important for several reasons:
Clear goals: When we define the forecasting problem upfront, everyone knows what we're trying to achieve. It helps us align our expectations and make smart decisions based on the forecasted results.
Getting the right data: When we have a clear problem statement, we can figure out what data we actually need for the forecast. We know which variables matter and which ones are just noise. This way, we can clean up the data and ensure it's accurate, making our forecast better.
Picking the right model: With a clear problem in mind, we can try different forecasting models and techniques. We can look at things like patterns in the data, whether it's seasonal, and what might be driving it. This way, we can choose the best model that suits our problem and makes our forecasts more effective.
Using resources wisely: A well-formulated problem helps us allocate our resources appropriately. We know how much detail we need in the forecast, how much time and effort to put in, and what tools and expertise we'll need. This saves us from wasting resources and money on things we don't really need.
Checking our performance: By defining the problem clearly, we can set up ways to check how well our forecast is doing. We can use metrics like mean absolute error (MAE) or root mean squared error (RMSE) to see how close our predictions are to the actual results. This helps us compare different models and see which one works best. It's ok if you don't understand what these metrics mean. I'll explain this in a future blog.
Making better decisions: Accurate and timely forecasts are essential for making good decisions in areas like finance, supply chain management, and resource planning. A well-formulated problem helps us generate reliable predictions that support decision-making. It gives us the information to predict future demand, allocate resources wisely, manage risks, and take advantage of opportunities.
So, when we take the time to define our forecasting problem well, we get clear goals, use the right data, pick the best model, allocate resources wisely, evaluate our performance, and make informed decisions. This sets us up for accurate forecasts, better planning, efficiency, and smarter decision-making.
PHIVE Framework
PHIVE is a framework I learnt from Brandon Foltz. He is my go-to guy for all things statistics! Before discovering Brandon, I found statistics incredibly intimating and frustrating. All those Greek symbols, crazy formulas and esoteric terminologies make me want to tear my hair out! Ahhhhhhh~~~~~

Breathe~, right, PHIVE framework.
PHIVE is a guide for formulating time series problems. It is made up of five key components:
Purpose: "Why do we need this forecast?" It's about figuring out the reasons or goals behind generating the forecast. Are we making business decisions, planning resources, or optimizing strategies? Knowing the purpose helps us shape our forecast to fit the purpose like a puzzle piece.
Horizon: This is all about the time frame we're peering into. Are we interested in short-term or long-term forecasting? The horizon determines how far into the future we want to go. It also affects the type and amount of past data we'll need to consider. A short-term forecast may focus on recent data, while a long-term one may require a broader historical context.
Information: This is where we dive into the data we have. What kind of information is available to us? Is it reliable, timely, or maybe even a bit niche? We need to know if it's clean and whether we can trust it. We also should consider what specific data is necessary to meet our forecast's purpose and horizon.
Value: Determine the value and stakes associated with having accurate forecasts. Assess the impact of accurate or inaccurate forecasts on decision-making, outcomes, and potential interdependencies with other elements. Understanding the value of the forecast helps prioritize resources and efforts in developing and utilizing the forecast.
Evaluation: This is all about checking how well our forecast is performing. Instead of just focusing on a single-point forecast, looking at a range of values or confidence intervals is often better. That gives us a better sense of the forecast's reliability. We also want to keep evaluating and validating our forecast as new information and techniques come along. It's like fine-tuning our forecast as we go.
Common Time Series Models
Below are seven types of time-series forecasting models. Please note that the field of time series analysis is vast, and as such, there are many other models and variations that exist.
Naive Model: The naive model assumes that future values will be the same as the most recent observed value without considering any patterns or trends. For example, if the closing stock price today is $100, the naive model predicts the same price for tomorrow, regardless of historical fluctuations. The naive model is the simplest time series model. It is often used as a baseline for comparison.
Moving Average (MA) Model: The MA model predicts future values based on average of past observations. There are many moving average models, such as simple moving average, weighted moving average, and cumulative moving average. We won't dive into the different types but know that moving averages uses multiple sequential periods to generate forecasts. It also goes by several other names like rolling average, running average, and moving mean. Here is an example to help with your understanding. For instance, if you want to predict the demand for a particular product in the next month, you might calculate the average sales of the past three months and use that average as your forecast. A picture of a zipper surface in my head when people talk to me about moving average. As a zipper slides across, a new set of values are created.
Autoregressive (AR) Model: The AR model utilizes linear regression on past observations to forecast future values. It considers the relationship between previous values in the time series. For example, to predict future monthly revenue, the model analyzes the revenue data from the past few months, taking into account the trend and relationship between them. A pitfall of AR model is that it may not account for seasonality or external factors affecting the time series.
Autoregressive Moving Average (ARMA) Model: The ARMA model combines both autoregressive and moving average components. It incorporates linear regression of past values and the weighted average of past errors for forecasting. Suppose we want to forecast daily electricity consumption. The ARMA model would consider previous days' consumption levels and past predictions' errors to make accurate forecasts.
Autoregressive Integrated Moving Average (ARIMA) Model: The ARIMA model is an extension of ARMA. ARIMA helps make predictions when the data is not stable or has trends. It does this by using a technique called differencing, which is like ironing out the wrinkles in the data.
Imagine you're trying to forecast quarterly sales for a company. The ARIMA model would first identify any underlying trends, such as sales consistently increasing or decreasing over time. It then removes these trends, making the data "smooth" or stationary. This is similar to ironing out the fabric to make it flat.
Once the data is made stationary, the ARIMA model uses the remaining patterns and relationships to forecast future sales figures. By removing the trends and seasonality, the ARIMA model helps us focus on the core patterns and make more accurate predictions.
Seasonal ARIMA (SARIMA) Model: The SARIMA model builds upon the ARIMA model by incorporating seasonality. It takes into account both seasonal and non-seasonal components to make accurate predictions. For instance, when forecasting monthly hotel bookings, the SARIMA model considers both the overall trend and the seasonal variations caused by holidays or vacation seasons.
Exponential Smoothing Model: Exponential smoothing models assign exponentially decreasing weights to past observations. They capture trends and seasonality in the data. An example would be using a simple exponential smoothing model to forecast quarterly revenue by placing higher weight on recent quarters while progressively reducing the impact of older quarters.
There you have it. I hope this dive into forecasting has helped you better understand and appreciate time series forecasting and the importance of having a well-formulated forecasting problem before you get your hands dirty in the analysis. Next time you have a forecasting project, remember to use the PHIVE framework.