What is Geographic Information System (GIS)?

Back in school we used to group kids into two categories: street smart or book smart. Little did I know then that intelligence comes in many different dimensions. Depending on the sources, the number of intelligence types may vary, but here I've compiled a list of nine:
- Naturalist (nature smart)
- Musical (sound smart)
- Logical-mathematical (number/reasoning smart)
- Existential (life smart)
- Interpersonal (people smart)
- Bodily-kinesthetic (body smart)
- Linguistic (word smart)
- Intra-personal (self smart)
- Spatial (picture smart)
In the traditional educational system, we are primarily measured against linguistic and logical-mathematical intelligence- your classic book smart. Some people perceive me to be one, but I'm not. I've mentioned previously how I struggled in school. I wasn't book smart or possess any impressive street smarts. I would consider myself a sheltered and somewhat ignorant kid. It wasn't until much later that I stumbled upon the concept of multiple intelligences and discovered a list of different types of intelligence, like the above.
One particular intelligence that struck a chord with me was spatial intelligence. I knew I was more developed in this intelligence type than in any other type. It explains why I'm a bit of a daydreamer. I have this knack for visualising how things fit together. Directions are a piece of cake for me, probably because I can conjure an aerial view of the geography in my head. I enjoy drawing and painting, especially portraits. I naturally gravitate towards topics requiring a decent amount of spatial intelligence, like architecture, engineering, design and geographic information system (GIS). If you're interested in finding out your intelligence type, take the quiz by Science of People.
I first stumbled upon the term GIS a couple of years ago while researching how to create territories in Tableau. I spent an hour or two looking into GIS. I'd established that it was a vast field requiring decent energy and effort to learn it. I didn't pursue the topic further. However, every so often, the thought of learning GIS would surface. I'm undecided whether I should and whether it's the right time to learn it. However, to help me decide, I spent some more time delving into this topic. So in this blog, I would like to share some of the content I've picked up. I'll cover the following topics listed below.
- What is GIS?
- A brief history of GIS
- What can we do with GIS?
- Technologies used in GIS
What is GIS?
There are several definitions of GIS. Based on what I could gather, this definition tends to be favoured by GIS professionals:
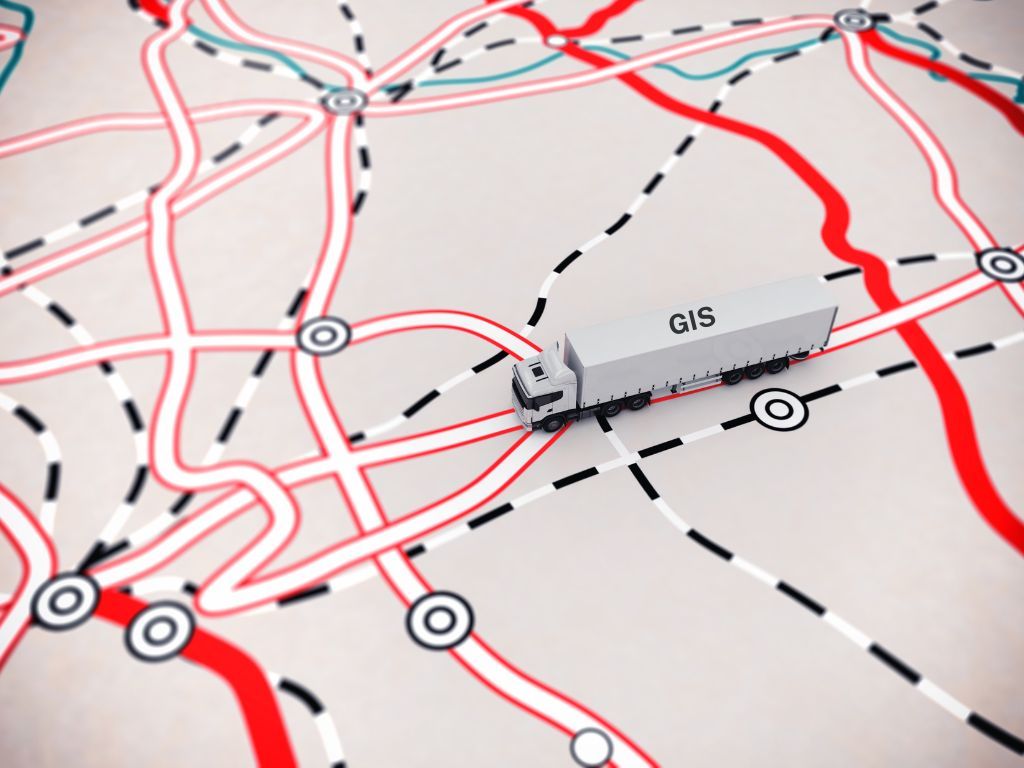
Geographic Information System is a system designed to capture, store, manipulate, analyse, manage, and present spatial or geographic data.
Brief History of GIS
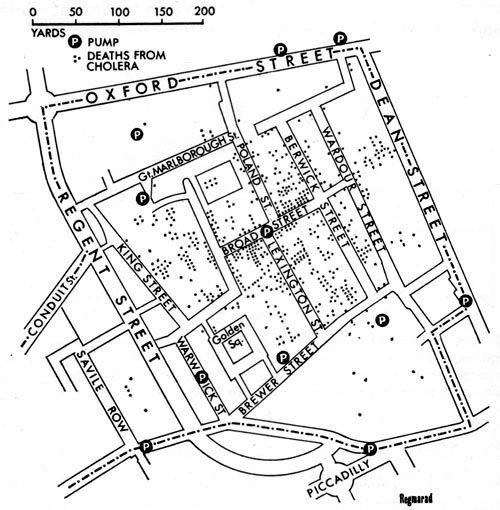
GIS was born out of cholera. It can be traced back to the 1800s. One of the first documented applications of GIS was by English physician, John Snow, in 1854.
Through mapping cholera-related deaths in Soho, London, Snow successfully pinpointed the origin of the outbreak: a public water pump contaminated by a neighbouring cesspit. As a result of his discovery, the handle of the pump was removed, effectively putting an end to the epidemic. This highlights the key role mapping geographic information can play in improving understanding of a situation and ensuring better decision-making.
However, it wasn't until the 1960s that GIS took off with the pioneering work of Roger Tomlinson, who developed the first map-based data system for the Canadian government. Many other organisations and institutions, like the environmental systems research institute (ESRI) and Harvard University, joined in embracing GIS technology. As the years passed, GIS evolved, with a surge in its adoption by governments and companies in the 1990s. In recent years, there has been an explosion of user adoption and advances in cloud technology, leading to an ever-growing modern GIS ecosystem.
Today, GIS continues to play an important role. It's helping us tackle big challenges like climate change and problems like optimising transportation routes and identifying suitable locations for critical infrastructure like fire stations.
What Can We Do With GIS?
The application of GIS can be broadly grouped not three categories:
- View
- 3D modelling
- Analysis
View
GIS allows us to visualise geographical data on interactive maps. An example everyone knows of is Google Maps.
Create 3D Models
More recent development due to GIS technology advancements enriches our understanding of geographical landscapes and structure. We can develop intricate 3D representations of urban environments, complete with buildings, roads, and landmarks. We can also visualise terrain and elevation data in 3D, enabling better topographic features and landforms analysis.
Analysis
I think the true power of GIS lies in its capacity for spatial analysis, which helps us unearth meaningful insights from geographic data. There are several types of analysis. Here are some common types, along with examples.
Spatial Analysis: examining the patterns and relationships in geographic data.For example, identifying clusters of high-crime areas in a city.
Proximity Analysis: measuring distances and finding nearest features. For example, finding the closest hospital to each neighbourhood.
Overlay Analysis: combining multiple layers of data to create new information. For example, identifying suitable locations for a new park by considering land use and proximity to residential areas.
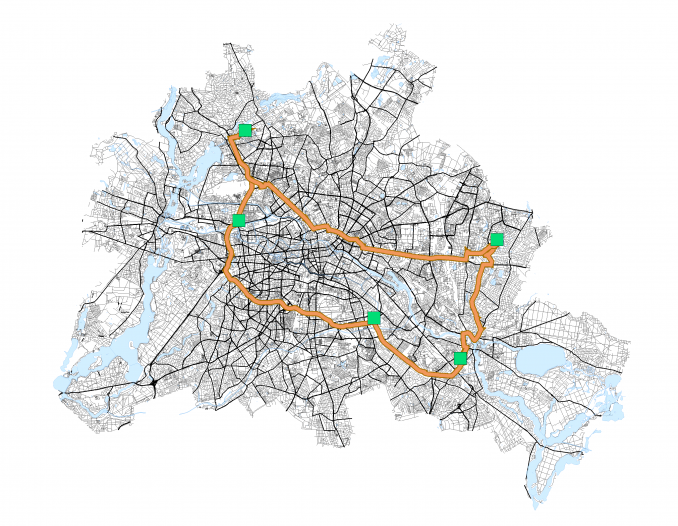
Network Analysis: studying transportation networks and finding optimal routes. For example, determining the shortest route for a delivery truck to reach multiple destinations.
Suitability Analysis: evaluating the appropriateness of different locations for specific activities. For example, assessing the best sites for wind farms based on wind speed, accessibility, and environmental factors.
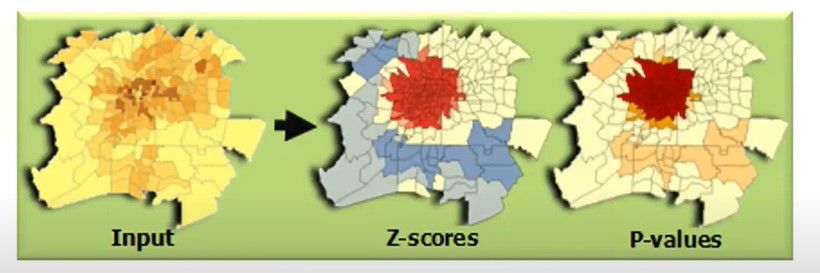
Hotspot Analysis: identifying clusters of high or low values in geographic data. For example, detecting areas with a high concentration of disease outbreaks to focus healthcare resources.
Spatial Statistics- statistical methods to study spatial patterns and relationships in geospatial data. It helps identify trends, clusters, and dependencies in spatially correlated information. For example, in environmental studies, it can be used to examine the spatial distribution of pollution levels in a river system, identifying hotspots and guiding targeted mitigation efforts.
Buffer Analysis: involves creating zones of a specified distance around geographic features. It helps understand the influence or impact of certain features on surrounding areas. For example, a city's environmental department wants to assess the impact of noise pollution from a newly proposed industrial area on the surrounding residential neighbourhoods. They aim to create buffer zones around the industrial area to identify which residential areas might be affected by high noise levels.
Technologies Used in GIS
There are vast arrays of technologies used in GIS. I'll focus on the common software used for GIS analysis. I have divided them into commercial and open-source (free).
Commercial
ArcGIS (from Esri): A powerful and widely used commercial GIS software with comprehensive tools for data management, spatial analysis, and cartography. It is popular in various industries and government organisations. Esri has many GIS products. All product starts with ArcGIS. One of the sources I viewed quoted that they have about 50% of the market share in this space.
Cartographica: A GIS software designed for macOS users, offering data visualisation, editing, and geospatial analysis capabilities.
Open-Source
QGIS: An open-source GIS software that provides a broad set of geospatial tools and functions. It is known for its user-friendly interface and extensive plugin support. This application is recommended if you're interested in getting started in GIS.
GRASS GIS: An open-source GIS software focusing on geospatial analysis, image processing, and spatial modelling. It is commonly used in academic and research environments.
Leaflet: An open-source JavaScript library for creating interactive web maps, commonly used for web-based GIS applications.
Mapbox: Mapbox offers a suite of tools and APIs for creating custom maps, geocoding, and location-based services. It is often used in web and mobile app development. Mapbox can be integrated with Tableau.
That's a wrap. Through this GIS exploration, I realised there is a lot of synergy between GIS and data analytics. Many skills in data analytics are also relevant in the modern form of GIS, which requires knowledge of SQL, programming language and cloud computing. Given that in the industry I work in, spatial data isn't so prominent. I will again defer pursuing GIS extensively. I think I'm better off deepening my data analytics, statistics, and machine learning expertise for now.