What is Poisson Distribution?

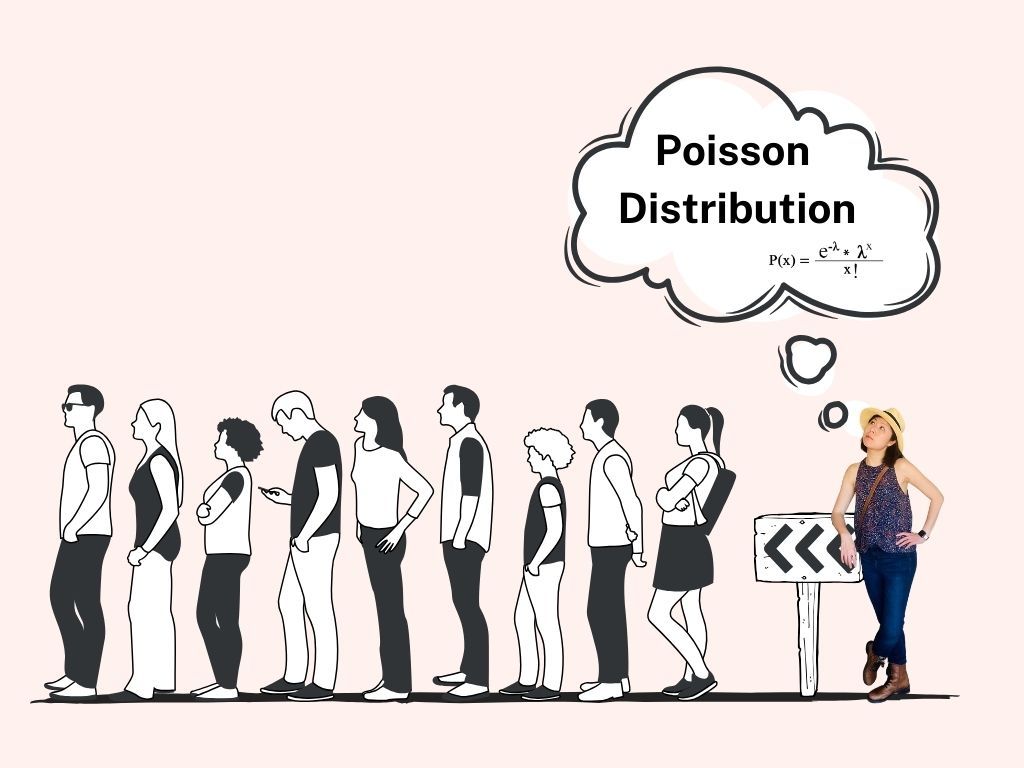
When I used to work in a retail pharmacy, I've always been intrigued by the trend in customer arrival before the door shuts. This particular pharmacy I used to work at closes its doors at 8:00 pm every Thursday and is situated in a shopping centre. In the last 15 minutes before closing, there is consistently a surge in customers seeking to pick up prescriptions and purchase over-the-counter medicines.
More often than not, I would finish my shift late because of this influx. 😪 Had I been wiser back then, I could have used Poisson distribution to analyze and manage this rush. Yes, you've guessed it! I'll be sharing with you about Poisson distribution.
I have an embarrassing confession; I mistakenly referred Poisson distribution as Poison distribution and even said it out loud 😅. But hey, on the brighter side, this mix-up etched the term firmly into my grey-and-white matters. Poisson distribution is another one of those must-know distributions, like the normal and binomial distributions. If you need help with its pronunciation, click here.
That said, in this blog, we will look at the following:
- What is Poisson Distribution?
- Worked Example of Poisson Distribution
- Characteristics of Poisson Distribution
- Application of Poisson Distribution
What is Poisson Distribution?
Poisson distribution is named after French mathematician Simeon Denis Poisson. The formal definition of Poisson distribution is a discrete probability distribution that expresses the probability of a given number of events occurring in a fixed interval of time, length, distance, area or volume.
Let's simplify this. Poisson distribution allows us to estimate how many times an event can happen in a specified time if we're talking about interval in terms of time—for example, the number of hungry people entering McDonald's per day. 🤤
Poisson distribution is a cousin of binomial distribution. It works similarly to binomial. It is a special case of binomial. If you're curious to understand the relationship between the two, check out Andrew Chamerlain's Deriving the Poisson Distribution from the Binomial Distribution.
Apart from statistics, Poisson distribution is used extensively in operations management, specifically queueing theory, a branch of applied mathematics and operations research that focuses on the study of queues or waiting lines. It is used to analyze and model systems where entities, such as people, tasks, or data packets, arrive at a service facility and must wait in line (queue) to be served by one or more service channels. Queueing theory is widely applied in various fields, including computer science, telecommunications, transportation, manufacturing, and service industries like healthcare and customer service.
Worked Example of Poisson Distribution
Let's use the pharmacy situation I explained in the introduction. How can I use Poisson distribution to analyze and manage the rush of customers 15 minutes before closing?
Let's say I could manage 12 customers and finish on time, but I would finish late if I had more customers. To help me manage the rush, I would like to know the probability of 12 customers turning up in the last 15 minutes, and what is the likelihood of seeing more than 12 customers during the last 15 minutes?
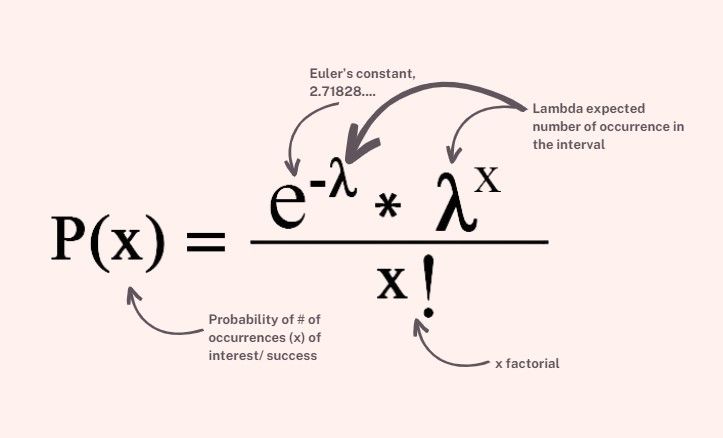
- P(x) is the probability of the number of occurrences of interest. In our example, it's the probability of x number of people arriving at the pharmacy during the last 15 minutes.
- x is the number of events we want to find the probability for. In our case, it's the number of people arriving at the pharmacy during the last 15 minutes.
- x! means x factorial, multiplying all the numbers from 1 to x together. For instance, if x is 5, x! (x factorial) is 5x4x3x2x1 = 120.
- e is just a constant, but an important one like the famous Pi. As a name, this number is Euler's constant and is found in many contexts and is the base of natural logarithms. It makes an appearance in modelling many natural events such as exponential growth and decay processes like compound interest, population growth, spread of disease, etc.
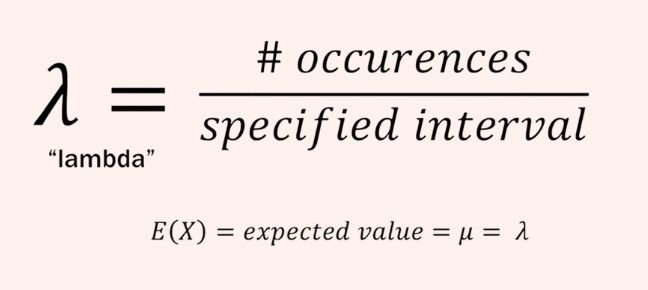
- λ (lambda) is the average rate or mean number of events that occur in the interval. This refers to the number of people we expect during the last 15 minutes. Sometimes, you'll see people referring to the expected value, the mean as well, but they mean the same thing.
Looking at this Formula, there is really just one parameter we need to figure out: lambda. I could approach this by collecting data on the number of customers arriving at the pharmacy during the final 15 minutes before closing over several weeks. I would then take an average of the numbers collected. For illustration, let's say the average number of customers arriving at the pharmacy during the final 15 minutes before closing is 11. Lamda would be 11 customers during the 15 minutes before closing. It's important to note we're not dividing. Lamda is interval specific. For example, if I want to know the lambda for 30 minutes, I would need to multiply 11 people by two, as two lots of 15 minutes give you 30 minutes.
We have all the information we need now to plug it into the Formula and get the answer to our question number 1: What is the probability of 12 customers turning up during the last 15 minutes?
P(x) = (e^(-λ) * λ^x) / x!
P(x) = (e^(-11) * 11^12) / 11!
P(x) = 11%
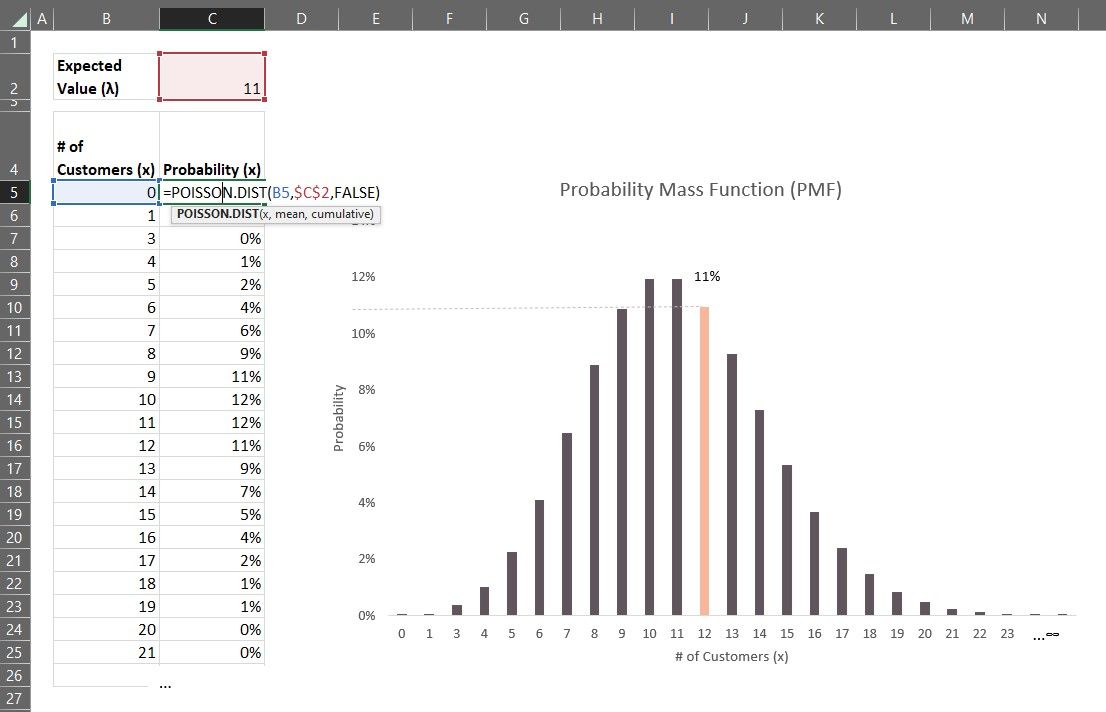
We can do this quite easily using the Excel function:
=POISSON.DIST(x, mean, cumulative)
I've created a Poisson probability mass function (PMF) chart for this. If you need a refresher on PMF, check out my Probability Distributions for Beginners blog. We can see that the probability of 12 customers is 11%.
Now for question 2: what is the probability of seeing more than 12 customers during the last 15 minutes?
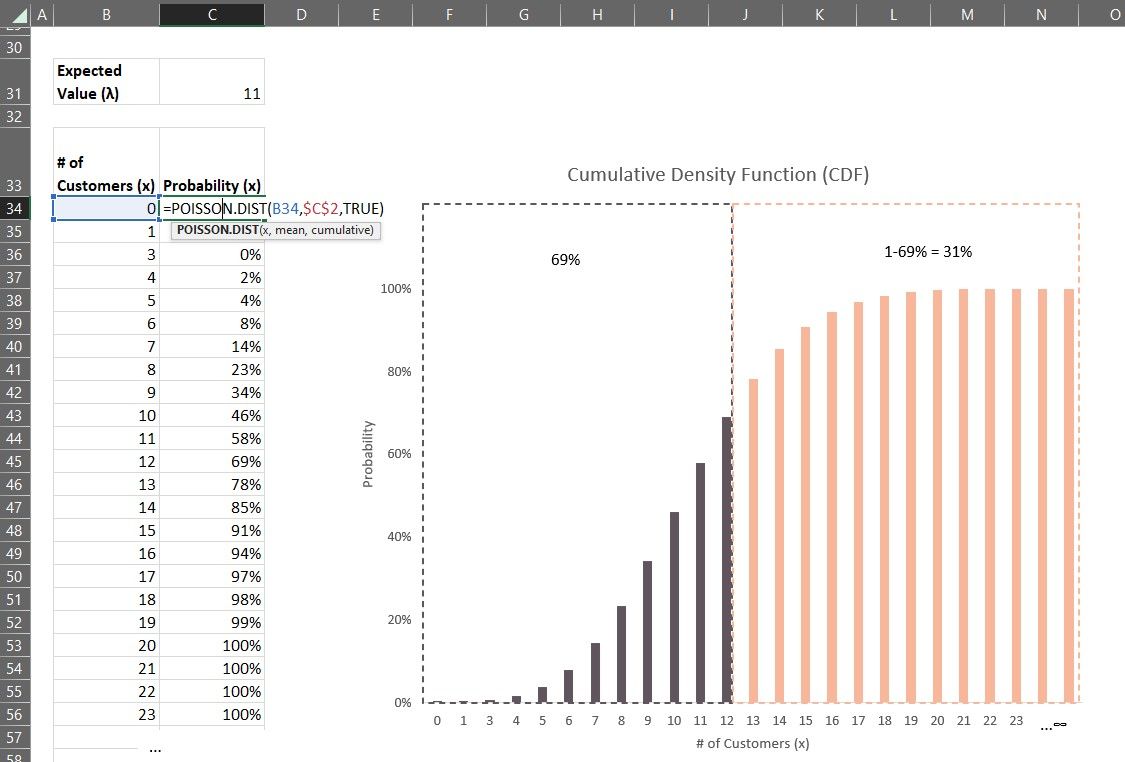
This requires us to use the Poisson Cumulative Density Function (CDF). Check out my Probability Distributions for Beginners blog, if you're unsure of CDF. I will emphasize that it's essential to understand the concept of PMF (/PDF in the case of continuous distribution) and CDF because this is foundational for all probability distributions. There is one for each type of probability distribution.
Now, just quickly, the CDF, captures all the probabilities accumulated as we move along the number of events (x). So, it helps us understand the likelihood of getting the value up to a certain point.
For question two, we want to know the probability of more than 12 customers arriving during the last 15 minutes break.
Note these two points:
- We can only calculate the probability of the prior values using CDF, i.e. where x = 0 to x = 12, but we want to know x> 12.
- All probability distribution curves, whether normal, binomial, poisson, geometric, etc.… they add up to one.
With these two points in mind, we can calculate the probability of observing more than 12 customers by first calculating the CDF where x = 12 and then subtracting it by 1 (100%).
Here, let's look at this graph to help us understand. We have a 69% chance of observing 0 to 12 customers during the 15 minutes. The probability of seeing more than 12 customers would then be 1 -69%, which is 39%.
This tells me there is a 39% chance that I'll finish later than 8 pm! To reduce the likelihood of finishing late, I could ask my boss to extend the shift of an assistant as one of the options.
Application of Poisson Distribution
The Poisson distribution has a wide range of real-world applications. Here are some examples:
Web Server Analysis: Web administrators use the Poisson distribution to model website traffic, such as the rate at which users access a website. This is valuable for optimizing server capacity and performance.
Epidemiology: Epidemiologists use the Poisson distribution to study the occurrence of rare diseases or outbreaks within a population over a specific time frame. It aids in understanding the spread of diseases and estimating the risk of infection.
Telecommunications: In telecommunication networks, the Poisson distribution is used to model the arrival rate of phone calls at a switchboard within a certain time period. This helps in capacity planning and determining the number of lines or operators needed to handle incoming calls efficiently.
Quality Control: In manufacturing, the Poisson distribution is used to analyze the rate of defects or errors in a production process. It helps in identifying areas that require improvement and implementing quality control measures.
Call Center Management: Call centres utilize the Poisson distribution to predict the number of incoming calls during different time periods, enabling them to allocate staff efficiently to handle customer inquiries.
So there you have it, Poisson distribution. It is a valuable statistical tool that helps us understand and predict the likelihood of events occurring within a fixed interval of time, distance, area, or volume. It has many real-world applications, especially in queuing scenarios. So, next time you find yourself waiting in a queue or dealing with a surge of customers before closing, keep the Poisson distribution in mind.